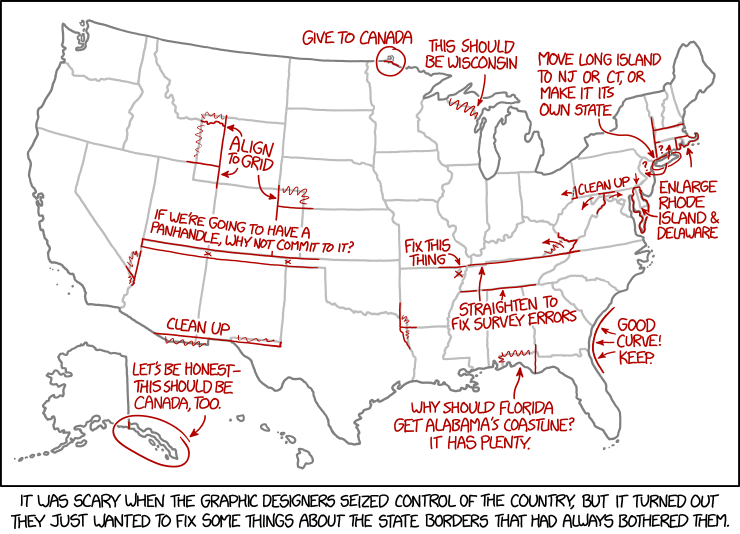
I shared this post on the Kim Schlossberg Designs Facebook page a couple of weeks ago. It was by far my most successful post on this page. It had 4,200 organic views, including 236 reactions, comments, and shares. In case you weren’t one of the 4.2K people who saw the post from my page (or millions other who saw it directly from xkcd.com), here it is, for your amusement and enjoyment. I hope you agree that it’s a unique, funny, and entertaining cartoon.
I share a lot of different content on that page. Recent posts have included: how to make your family name plural on your holiday cards (no apostrophe needed), a major brand standing up against bullying, a book about typesetting, and a beautiful print package. Please let me know why you think this cartoon was heads and tails more popular than the other posts. And, while you’re at it, please let me know what else you’d like me to write about or share.

Do you know all the information that’s available on your Facebook page Insights tab? You can see how many actions, likes, and engagements you got over the past week (or 28 days). On my page, I can see that my fans are on Facebook just about every day, and mostly from 9am to 9pm. My fans are around 65% female. Most speak US English, but 12 speak UK English and one speaks Pirate. We can see how many likes, clicks, and engagements we got from each post, broken down by promoted and organic (not boosted). Interesting information to pay attention to.
If you’re advertising on Facebook, this article from AdStage shares a good checklist on how to audit your own advertising campaign.
- How 2020 can make 2021 better - December 28, 2020
- Welcome to the Kim Schlossberg Designs newsletter - December 18, 2020
- A Strong Brand is the Key to Resilience - April 10, 2020
